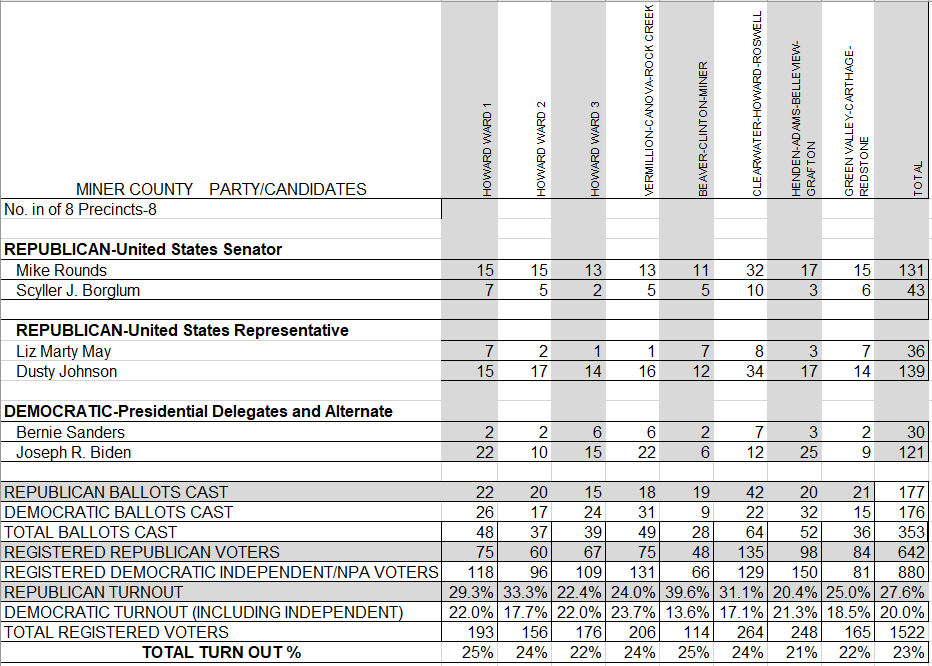
2020 General Election Results
Statewide election results available here.
.png)
.png)
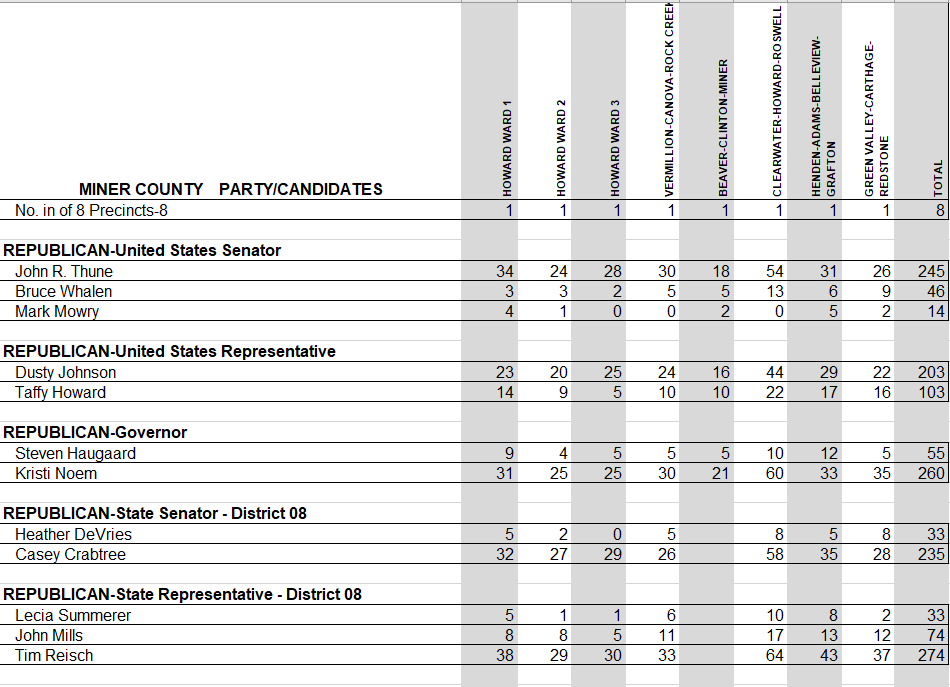
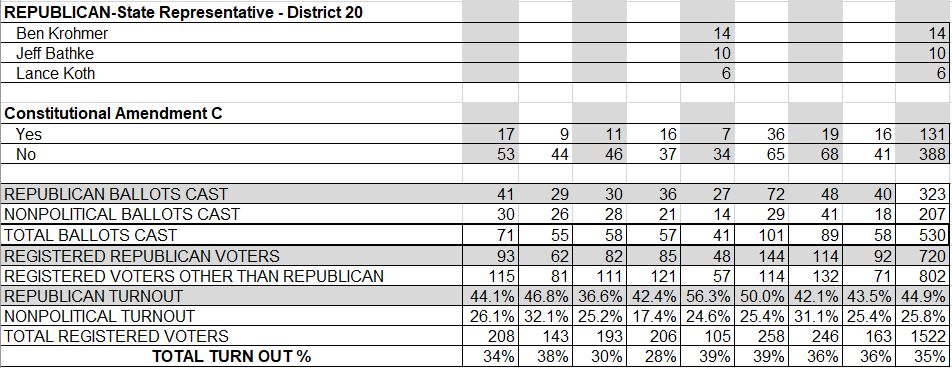
2020 Primary Election Results
2018 General Election Results
| MINER COUNTY PARTY/CANDIDATES |
HOWARD WARD 1 |
HOWARD WARD 2 |
HOWARD WARD 3 |
VERMILLION-CANOVA-ROCK CREEK |
BEAVER-CLINTON-MINER |
CLEARWATER-HOWARD-ROSWELL |
HENDEN-ADAMS-BELLEVIEW-GRAFTON |
GREEN VALLEY-CARTHAGE-REDSTONE |
TOTAL |
| No. in of 8 Precincts- |
1 |
1 |
1 |
1 |
1 |
1 |
1 |
1 |
8 |
|
|
|
|
|
|
|
|
|
|
| UNITED STATES REPRESENTATIVE |
|
|
|
|
|
|
|
|
|
| George D. Hendrickson-Libertarian Party |
4 |
1 |
0 |
1 |
1 |
3 |
1 |
2 |
13 |
| Dustin "Dusty" Johnson-Republican Party |
69 |
70 |
60 |
84 |
45 |
126 |
113 |
75 |
642 |
| Tim Bjorkman-Democratic Party |
62 |
53 |
46 |
55 |
30 |
55 |
78 |
34 |
413 |
| Ron Wieszorek-Independent |
2 |
2 |
5 |
6 |
7 |
2 |
6 |
1 |
31 |
|
|
|
|
|
|
|
|
|
|
| GOVERNOR AND LIEUTENANT GOVERNOR |
|
|
|
|
|
|
|
|
|
| Kurt Evans/Richard Shelatz-Libertarian Party |
2 |
0 |
0 |
3 |
0 |
1 |
2 |
4 |
12 |
| Kristi Noem/Larry Rhoden-Republican Party |
63 |
47 |
50 |
63 |
42 |
103 |
85 |
70 |
523 |
| Billie Sutton/Michelle Lavallee-Democratic Party |
73 |
80 |
62 |
81 |
39 |
84 |
113 |
38 |
570 |
|
|
|
|
|
|
|
|
|
|
| SECRETARY OF STATE |
|
|
|
|
|
|
|
|
|
| Steve Barnett-Republican Party |
76 |
69 |
64 |
78 |
56 |
120 |
124 |
77 |
664 |
| Alexandra Frederick-Democratic Party |
53 |
46 |
37 |
47 |
20 |
52 |
51 |
32 |
338 |
|
|
|
|
|
|
|
|
|
|
| ATTORNEY GENERAL |
|
|
|
|
|
|
|
|
|
| Jason Ravnsborg-Republican Party |
61 |
55 |
52 |
69 |
41 |
106 |
109 |
76 |
569 |
| Randy Seiler-Democratic Party |
69 |
64 |
49 |
61 |
36 |
69 |
75 |
34 |
457 |
|
|
|
|
|
|
|
|
|
|
| STATE AUDITOR |
|
|
|
|
|
|
|
|
|
| Rich Sattgast-Republican Party |
72 |
66 |
64 |
68 |
53 |
123 |
111 |
83 |
640 |
| Tom Cool-Democratic Party |
55 |
48 |
33 |
43 |
19 |
47 |
59 |
24 |
328 |
|
|
|
|
|
|
|
|
|
|
| STATE TREASURER |
|
|
|
|
|
|
|
|
|
| Josh Haeder-Republican Party |
72 |
59 |
59 |
66 |
42 |
109 |
106 |
74 |
587 |
| Aaron Matson-Democratic Party |
53 |
52 |
34 |
47 |
28 |
53 |
60 |
27 |
354 |
|
|
|
|
|
|
|
|
|
|
| COMMISSIONER OF SCHOOL AND PUBLIC LANDS |
|
|
|
|
|
|
|
|
|
| Ryan Brunner-Republican Party |
67 |
63 |
61 |
67 |
50 |
109 |
104 |
73 |
594 |
| Woody Houser-Democratic Party |
52 |
48 |
32 |
46 |
21 |
55 |
66 |
29 |
349 |
|
|
|
|
|
|
|
|
|
|
| PUBLIC UTILITIES COMMISSIONER |
|
|
|
|
|
|
|
|
|
| Kristie Fiegen-Republican Party |
76 |
75 |
69 |
86 |
56 |
120 |
131 |
78 |
691 |
| Wayne Frederick-Democratic Party |
49 |
43 |
34 |
39 |
17 |
49 |
47 |
28 |
306 |
|
|
|
|
|
|
|
|
|
|
| STATE SENATOR DISTRICT 8 |
|
|
|
|
|
|
|
|
|
| Jordan Youngberg-Republican Party |
64 |
62 |
52 |
63 |
52 |
113 |
106 |
73 |
585 |
| Scott Parsley-Democratic Party |
68 |
67 |
56 |
79 |
27 |
72 |
87 |
38 |
494 |
|
|
|
|
|
|
|
|
|
|
| STATE REPRESENTATIVES DISTRICT 8 |
|
|
|
|
|
|
|
|
|
| Marli Wiese-Republican Party |
73 |
69 |
63 |
81 |
48 |
125 |
115 |
73 |
647 |
| Randy Gross-Republican Party |
61 |
53 |
49 |
72 |
36 |
97 |
93 |
71 |
532 |
| Chris Francis-Democratic Party |
41 |
36 |
23 |
37 |
15 |
34 |
36 |
20 |
242 |
| Jason Unger-Democratic Party |
55 |
50 |
44 |
53 |
26 |
62 |
67 |
31 |
388 |
|
|
|
|
|
|
|
|
|
|
| MINER COUNTY SHERIFF |
|
|
|
|
|
|
|
|
|
| Lanny Klinkhammer-Independent |
49 |
37 |
34 |
60 |
23 |
66 |
66 |
15 |
350 |
| Rob Eggert-Independent |
87 |
90 |
76 |
83 |
56 |
121 |
129 |
89 |
731 |
| James Stainbrook-Independent |
1 |
4 |
0 |
1 |
1 |
1 |
2 |
5 |
15 |
|
|
|
|
|
|
|
|
|
|
| COUNTY COMMISSIONER AT LARGE |
|
|
|
|
|
|
|
|
|
| Roger Wentland-Republican Party |
102 |
89 |
64 |
60 |
30 |
131 |
144 |
66 |
686 |
| Garrett D Gassman-Democratic Party |
77 |
64 |
56 |
99 |
25 |
78 |
107 |
50 |
556 |
| Tom Glanzer-Independent |
31 |
33 |
43 |
63 |
20 |
57 |
59 |
33 |
339 |
| Tom Reisch-Independent |
87 |
76 |
65 |
68 |
26 |
121 |
121 |
68 |
632 |
| Cindy Foster-Independent |
29 |
41 |
29 |
49 |
57 |
88 |
63 |
38 |
394 |
|
|
|
|
|
|
|
|
|
|
| SUPREME COURT JUSTICE RETENTION |
|
|
|
|
|
|
|
|
|
| JUSTICE JANINE M. KERN |
|
|
|
|
|
|
|
|
|
| Yes |
87 |
91 |
67 |
88 |
51 |
128 |
127 |
78 |
717 |
| No |
18 |
14 |
16 |
23 |
15 |
17 |
31 |
17 |
151 |
|
|
|
|
|
|
|
|
|
|
| CONSTITUTIONAL AMENDMENT W |
|
|
|
|
|
|
|
|
|
| Yes |
53 |
39 |
41 |
61 |
23 |
58 |
81 |
41 |
397 |
| No |
69 |
70 |
58 |
78 |
58 |
112 |
106 |
69 |
620 |
|
|
|
|
|
|
|
|
|
|
| CONSTITUTIONAL AMENDMENT X |
|
|
|
|
|
|
|
|
|
| Yes |
53 |
44 |
38 |
57 |
36 |
71 |
76 |
39 |
414 |
| No |
65 |
66 |
56 |
78 |
44 |
95 |
103 |
70 |
577 |
|
|
|
|
|
|
|
|
|
|
| CONSTITUTIONAL AMENDMENT Z |
|
|
|
|
|
|
|
|
|
| Yes |
56 |
66 |
49 |
68 |
47 |
77 |
83 |
56 |
502 |
| No |
59 |
46 |
47 |
66 |
29 |
85 |
91 |
53 |
476 |
|
|
|
|
|
|
|
|
|
|
| INITIATED MEASURE 24 |
|
|
|
|
|
|
|
|
|
| Yes |
45 |
57 |
44 |
72 |
42 |
75 |
103 |
44 |
482 |
| No |
69 |
55 |
51 |
64 |
35 |
91 |
75 |
65 |
505 |
|
|
|
|
|
|
|
|
|
|
| INITIATED MEASURE 25 |
|
|
|
|
|
|
|
|
|
| Yes |
50 |
39 |
38 |
49 |
31 |
69 |
91 |
49 |
416 |
| No |
80 |
78 |
71 |
95 |
51 |
108 |
103 |
64 |
650 |
|
|
|
|
|
|
|
|
|
|
|
|
|
|
|
|
|
|
|
|
| BALLOTS CAST |
140 |
131 |
113 |
147 |
83 |
189 |
201 |
113 |
1117 |
| REGISTERED VOTERS |
190 |
177 |
172 |
220 |
115 |
271 |
254 |
160 |
1559 |
| TURN OUT % |
74% |
74% |
66% |
67% |
72% |
70% |
79% |
71% |
72% |
2018 Primary Election Results
| MINER COUNTY PARTY/CANDIDATES |
HOWARD WARD 1 |
HOWARD WARD 2 |
HOWARD WARD 3 |
VERMILLION-CANOVA- ROCK CREEK |
BEAVER-CLINTON-MINER |
CLEARWATER-HOWARD- ROSWELL |
HENDEN-ADAMS- BELLEVIEW-GRAFTON |
GREEN VALLEY- CARTHAGE-REDSTONE |
TOTAL |
| No. in of 8 Precincts-8 |
1 |
1 |
1 |
1 |
1 |
1 |
1 |
1 |
8 |
|
|
|
|
|
|
|
|
|
|
| REPUBLICAN-United States Representative |
|
|
|
|
|
|
|
|
|
| Neal Tapio |
6 |
4 |
4 |
11 |
8 |
17 |
10 |
8 |
68 |
| Shantel Krebs |
6 |
5 |
6 |
1 |
12 |
16 |
8 |
8 |
62 |
| Dustin "Dusty" Johnson |
11 |
11 |
8 |
10 |
8 |
22 |
12 |
15 |
97 |
|
|
|
|
|
|
|
|
|
|
| REPUBLICAN-Governor |
|
|
|
|
|
|
|
|
|
| Marty Jackley |
16 |
9 |
4 |
3 |
5 |
20 |
18 |
14 |
89 |
| Kristi Noem |
7 |
12 |
15 |
20 |
23 |
36 |
13 |
18 |
144 |
|
|
|
|
|
|
|
|
|
|
| CONSTITUTIONAL AMENDMENT Y |
|
|
|
|
|
|
|
|
|
| Yes-Adopt the Amendment. |
28 |
27 |
20 |
29 |
28 |
53 |
34 |
31 |
250 |
| No-Leave the Constitution as it is. |
10 |
4 |
8 |
5 |
8 |
8 |
7 |
9 |
59 |
|
|
|
|
|
|
|
|
|
|
| REPUBLICAN BALLOTS CAST |
25 |
21 |
19 |
23 |
28 |
56 |
31 |
32 |
235 |
| NON POLITICAL BALLOTS CAST |
14 |
12 |
11 |
13 |
8 |
10 |
12 |
10 |
90 |
| TOTAL BALLOTS CAST |
39 |
33 |
30 |
36 |
36 |
66 |
43 |
42 |
325 |
| REGISTERED REPUBLICAN VOTERS |
63 |
55 |
57 |
74 |
47 |
133 |
84 |
76 |
589 |
| REGISTERED OTHER THAN REPUBLICAN |
115 |
110 |
99 |
144 |
66 |
126 |
157 |
83 |
900 |
| REPUBLICAN TURNOUT |
39.7% |
38.2% |
33.3% |
31.1% |
59.6% |
42.1% |
36.9% |
42.1% |
39.9% |
| NONPOLITICAL TURNOUT |
12.2% |
10.9% |
11.1% |
9.0% |
12.1% |
7.9% |
7.6% |
12.0% |
10.0% |
| TOTAL REGISTERED VOTERS |
178 |
165 |
156 |
218 |
113 |
259 |
241 |
159 |
1489 |
| TOTAL TURN OUT % |
21.9% |
20.0% |
19.2% |
16.5% |
31.9% |
25.5% |
17.8% |
26.4% |
22% |
2016 General Election Results
| MINER COUNTY PARTY/CANDIDATES |
HOWARD WARD 1 |
HOWARD WARD 2 |
HOWARD WARD 3 |
VERMILLION-CANOVA-ROCK CREEK |
BEAVER-CLINTON-MINER |
CLEARWATER-HOWARD-ROSWELL |
HENDEN-ADAMS-BELLEVIEW-GRAFTON |
GREEN VALLEY-CARTHAGE-REDSTONE |
TOTAL |
| No. in of 8 Precincts- |
1 |
1 |
1 |
1 |
1 |
1 |
1 |
1 |
8 |
|
|
|
|
|
|
|
|
|
|
| PRESIDENTIAL ELECTORS |
|
|
|
|
|
|
|
|
|
| Trump & Pence Electors - Republican Party |
76 |
75 |
62 |
81 |
63 |
132 |
125 |
92 |
706 |
| Johnson & Weld Electors - Liberatarian Party |
8 |
7 |
13 |
11 |
2 |
10 |
6 |
10 |
67 |
| Clinton & Kaine Electors - Democratic Party |
51 |
38 |
26 |
44 |
18 |
41 |
40 |
23 |
281 |
| Castle & Bradley Electors - Constitution Party |
2 |
2 |
1 |
1 |
0 |
0 |
3 |
1 |
10 |
|
|
|
|
|
|
|
|
|
|
| UNITED STATES SENATOR |
|
|
|
|
|
|
|
|
|
| John R. Thune - Republican Party |
92 |
89 |
78 |
106 |
67 |
142 |
128 |
105 |
807 |
| Jay Williams - Democratic Party |
45 |
36 |
27 |
34 |
16 |
47 |
55 |
24 |
284 |
|
|
|
|
|
|
|
|
|
|
| UNITED STATES REPRESENTATIVE |
|
|
|
|
|
|
|
|
|
| Kristi Noem - Republican Party |
78 |
77 |
68 |
84 |
54 |
124 |
108 |
101 |
694 |
| Paula Hawks - Democratic Party |
59 |
48 |
37 |
55 |
30 |
65 |
74 |
30 |
398 |
|
|
|
|
|
|
|
|
|
|
| PUBLIC UTILITIES COMMISSIONER |
|
|
|
|
|
|
|
|
|
| Chris Nelson - Republican Party |
96 |
101 |
86 |
118 |
66 |
168 |
141 |
109 |
885 |
| Henry Red Cloud - Democratic Party |
29 |
20 |
18 |
22 |
16 |
19 |
33 |
19 |
176 |
|
|
|
|
|
|
|
|
|
|
| STATE SENATOR DISTRICT 8 |
|
|
|
|
|
|
|
|
|
| Jordan Youngberg - Republican Party |
47 |
49 |
36 |
54 |
50 |
107 |
78 |
82 |
503 |
| Scott Parsley - Democratic Party |
88 |
75 |
67 |
87 |
31 |
82 |
91 |
45 |
566 |
|
|
|
|
|
|
|
|
|
|
| STATE REPRESENTATIVES DISTRICT 8 |
|
|
|
|
|
|
|
|
|
| Mathew Wollmann - Republican Party |
58 |
67 |
62 |
77 |
46 |
137 |
94 |
83 |
624 |
| Leslie Heinemann - Republican Party |
59 |
57 |
52 |
76 |
46 |
105 |
71 |
68 |
534 |
| Jason Unger - Democratic Party |
70 |
57 |
42 |
57 |
29 |
67 |
76 |
44 |
442 |
| Kory Rawstern - Democratic Party |
41 |
32 |
24 |
39 |
17 |
28 |
43 |
23 |
247 |
|
|
|
|
|
|
|
|
|
|
| COUNTY COMMISSIONER AT LARGE |
|
|
|
|
|
|
|
|
|
| Lavonne Durant - Republican Party |
40 |
49 |
30 |
52 |
34 |
76 |
73 |
92 |
446 |
| Alex Protsch - Democratic Party |
94 |
67 |
66 |
66 |
37 |
112 |
108 |
31 |
581 |
| Patrick R. Maroney - Democratic Party |
30 |
32 |
23 |
22 |
15 |
43 |
38 |
11 |
214 |
| Tim Glanzer - Independent |
39 |
34 |
43 |
84 |
28 |
69 |
50 |
34 |
381 |
| Diane Rentz - Independent |
36 |
32 |
27 |
33 |
28 |
48 |
52 |
46 |
302 |
|
|
|
|
|
|
|
|
|
|
|
|
|
|
|
|
|
|
|
|
| CONSTITUTIONAL AMENDMENT R |
|
|
|
|
|
|
|
|
|
| Yes |
64 |
58 |
50 |
83 |
44 |
75 |
71 |
60 |
505 |
| No |
63 |
58 |
48 |
58 |
35 |
93 |
99 |
62 |
516 |
|
|
|
|
|
|
|
|
|
|
| CONSTITUTIONAL AMENDMENT S |
|
|
|
|
|
|
|
|
|
| Yes |
80 |
74 |
58 |
102 |
49 |
105 |
100 |
83 |
651 |
| No |
53 |
45 |
46 |
37 |
33 |
71 |
72 |
43 |
400 |
|
|
|
|
|
|
|
|
|
|
| CONSTITUTIONAL AMENDMENT T |
|
|
|
|
|
|
|
|
|
| Yes |
64 |
49 |
40 |
69 |
29 |
65 |
79 |
42 |
437 |
| No |
64 |
68 |
60 |
69 |
49 |
104 |
90 |
81 |
585 |
|
|
|
|
|
|
|
|
|
|
| CONSTITUTIONAL AMENDMENT U |
|
|
|
|
|
|
|
|
|
| Yes |
38 |
58 |
36 |
54 |
28 |
38 |
43 |
48 |
343 |
| No |
87 |
57 |
62 |
83 |
51 |
136 |
126 |
74 |
676 |
|
|
|
|
|
|
|
|
|
|
| CONSTITUTIONAL AMENDMENT V |
|
|
|
|
|
|
|
|
|
| Yes |
51 |
46 |
37 |
75 |
35 |
61 |
73 |
44 |
422 |
| No |
77 |
70 |
63 |
64 |
47 |
115 |
97 |
77 |
610 |
|
|
|
|
|
|
|
|
|
|
| INITIATED MEASURE 21 |
|
|
|
|
|
|
|
|
|
| Yes |
99 |
82 |
63 |
110 |
56 |
134 |
129 |
89 |
762 |
| No |
28 |
35 |
37 |
30 |
25 |
44 |
42 |
36 |
277 |
|
|
|
|
|
|
|
|
|
|
| INITIATED MEASURE 22 |
|
|
|
|
|
|
|
|
|
| Yes |
68 |
72 |
55 |
73 |
37 |
70 |
79 |
66 |
520 |
| No |
60 |
44 |
45 |
66 |
43 |
101 |
88 |
56 |
503 |
|
|
|
|
|
|
|
|
|
|
| INITIATED MEASURE 23 |
|
|
|
|
|
|
|
|
|
| Yes |
30 |
19 |
10 |
21 |
15 |
18 |
27 |
23 |
163 |
| No |
96 |
94 |
89 |
118 |
65 |
158 |
141 |
100 |
861 |
|
|
|
|
|
|
|
|
|
|
| REFERRED LAW 19 |
|
|
|
|
|
|
|
|
|
| Yes |
31 |
30 |
28 |
45 |
22 |
35 |
32 |
33 |
256 |
| No |
91 |
81 |
68 |
89 |
56 |
132 |
130 |
89 |
736 |
|
|
|
|
|
|
|
|
|
|
| REFERRED LAW 20 |
|
|
|
|
|
|
|
|
|
| Yes |
38 |
33 |
25 |
47 |
33 |
81 |
49 |
40 |
346 |
| No |
94 |
85 |
77 |
90 |
49 |
101 |
122 |
87 |
705 |
|
|
|
|
|
|
|
|
|
|
| BALLOTS CAST |
141 |
126 |
109 |
144 |
84 |
193 |
185 |
132 |
1114 |
| REGISTERED VOTERS |
190 |
181 |
157 |
223 |
112 |
276 |
241 |
167 |
1547 |
| TURN OUT % |
74% |
70% |
69% |
65% |
75% |
70% |
77% |
79% |
72% |
2016 Primary Election Results
| MINER COUNTY PARTY/CANDIDATES |
HOWARD WARD 1 |
HOWARD WARD 2 |
HOWARD WARD 3 |
VERMILLION-CANOVA-ROCK CREEK |
BEAVER-CLINTON-MINER |
CLEARWATER-HOWARD-ROSWELL |
HENDEN-ADAMS-BELLEVIEW-GRAFTON |
GREEN VALLEY-CARTHAGE-REDSTONE |
TOTAL |
| No. in of 8 Precincts-8 |
|
|
|
|
|
|
|
|
|
|
|
|
|
|
|
|
|
|
|
| REPUBLICAN-Delegates Support Pres. Candidate |
|
|
|
|
|
|
|
|
|
| John R. Kasich |
3 |
2 |
2 |
3 |
2 |
6 |
2 |
6 |
26 |
| Ted Cruz |
5 |
6 |
2 |
2 |
4 |
3 |
6 |
1 |
29 |
| Donald J. Trump |
16 |
13 |
7 |
5 |
11 |
23 |
6 |
17 |
98 |
|
|
|
|
|
|
|
|
|
|
| DEMOCRATIC-Presidential Delegates and Alternate |
|
|
|
|
|
|
|
|
|
| Bernie Sanders |
14 |
16 |
15 |
10 |
4 |
10 |
12 |
3 |
84 |
| Hillary Clinton |
16 |
19 |
12 |
16 |
9 |
9 |
19 |
9 |
109 |
|
|
|
|
|
|
|
|
|
|
| REPUBLICAN BALLOTS CAST |
24 |
21 |
11 |
10 |
17 |
33 |
15 |
24 |
155 |
| DEMOCRATIC BALLOTS CAST |
32 |
37 |
27 |
26 |
14 |
19 |
32 |
16 |
203 |
| TOTAL BALLOTS CAST |
56 |
58 |
38 |
36 |
31 |
52 |
47 |
40 |
358 |
| REGISTERED REPUBLICAN VOTERS |
68 |
64 |
57 |
74 |
49 |
142 |
81 |
78 |
613 |
| REGISTERED DEMOCRATIC INDEPENDENT/NPA VOTERS |
147 |
141 |
115 |
161 |
64 |
143 |
174 |
95 |
1040 |
| REPUBLICAN TURNOUT |
35.3% |
32.8% |
19.3% |
13.5% |
34.7% |
23.2% |
18.5% |
30.8% |
25.3% |
| DEMOCRATIC TURNOUT (INCLUDING INDEPENDENT) |
21.8% |
26.2% |
23.5% |
16.1% |
21.9% |
13.3% |
18.4% |
16.8% |
19.5% |
| TOTAL REGISTERED VOTERS |
215 |
205 |
172 |
235 |
113 |
285 |
255 |
173 |
1653 |
| TOTAL TURN OUT % |
26% |
28% |
22% |
15% |
27% |
18% |
18% |
23% |
22% |
2014 General Election Results
| MINER COUNTY PARTY/CANDIDATES |
HOWARD WARD 1 |
HOWARD WARD 2 |
HOWARD WARD 3 |
VERMILLION-CANOVA-ROCK CREEK |
BEAVER-CLINTON-MINER |
CLEARWATER-HOWARD-ROSWELL |
HENDEN-ADAMS-BELLEVIEW-GRAFTON |
GREEN VALLEY-CARTHAGE-REDSTONE |
TOTAL |
| No. in of 8 Precincts- |
1 |
1 |
1 |
1 |
1 |
1 |
1 |
1 |
8 |
|
|
|
|
|
|
|
|
|
|
| UNITED STATES SENATOR |
|
|
|
|
|
|
|
|
|
| Rick Weiland-Democratic Party |
47 |
36 |
25 |
44 |
23 |
41 |
60 |
20 |
296 |
| Mike Rounds-Republican Party |
49 |
48 |
33 |
44 |
31 |
85 |
57 |
58 |
405 |
| Gordon Howie-Independent |
3 |
5 |
0 |
3 |
7 |
3 |
6 |
5 |
32 |
| Larry Pressler-Independent |
18 |
22 |
16 |
22 |
9 |
29 |
25 |
10 |
151 |
|
|
|
|
|
|
|
|
|
|
| UNITED STATES REPRESENTATIVE |
|
|
|
|
|
|
|
|
|
| Corinna Robinson-Democratic Party |
49 |
35 |
26 |
43 |
21 |
43 |
50 |
17 |
284 |
| Kristi Noem-Republican Party |
65 |
74 |
47 |
71 |
48 |
113 |
93 |
75 |
586 |
|
|
|
|
|
|
|
|
|
|
| GOVERNOR AND LIEUTENANT GOVERNOR |
|
|
|
|
|
|
|
|
|
| Susan Wismer-Susy Blake-Democratic Party |
37 |
26 |
19 |
26 |
19 |
36 |
46 |
15 |
224 |
| Dennis Daugaard-Matt Michels-Republican Party |
76 |
81 |
50 |
83 |
46 |
115 |
98 |
72 |
621 |
| Michael J. Myers-Lora Hubbel-Independent |
3 |
6 |
4 |
3 |
3 |
4 |
2 |
6 |
31 |
|
|
|
|
|
|
|
|
|
|
| SECRETARY OF STATE |
|
|
|
|
|
|
|
|
|
| Lori Stacey-Constitution Party |
6 |
6 |
0 |
5 |
2 |
6 |
7 |
3 |
35 |
| Emmett Reistroffer-Libertarian Party |
1 |
4 |
1 |
3 |
1 |
1 |
3 |
5 |
19 |
| Angelia Schultz-Democratic Party |
48 |
32 |
28 |
48 |
18 |
40 |
57 |
24 |
295 |
| Shantel Krebs-Republican Party |
49 |
56 |
36 |
45 |
40 |
86 |
60 |
54 |
426 |
|
|
|
|
|
|
|
|
|
|
| ATTORNEY GENERAL |
|
|
|
|
|
|
|
|
|
| Chad Haber-Libertarian Party |
16 |
11 |
7 |
17 |
12 |
12 |
22 |
15 |
112 |
| Marty Jackley-Republican Party |
85 |
90 |
58 |
88 |
50 |
124 |
113 |
73 |
681 |
|
|
|
|
|
|
|
|
|
|
| STATE AUDITOR |
|
|
|
|
|
|
|
|
|
| Kurt Evans-Libertarian Party |
18 |
13 |
8 |
16 |
13 |
23 |
22 |
17 |
130 |
| Steve Barnett-Republican Party |
74 |
78 |
53 |
73 |
47 |
106 |
97 |
66 |
594 |
|
|
|
|
|
|
|
|
|
|
| STATE TREASURER |
|
|
|
|
|
|
|
|
|
| Ken Santema-Libertarian Party |
2 |
6 |
0 |
3 |
4 |
6 |
4 |
4 |
29 |
| Denny Pierson-Democratic Party |
51 |
36 |
31 |
42 |
25 |
41 |
50 |
21 |
297 |
| Rich Sattgast-Republican Party |
56 |
54 |
38 |
50 |
35 |
95 |
70 |
64 |
462 |
|
|
|
|
|
|
|
|
|
|
| COMMISSIONER OF SCHOOL |
|
|
|
|
|
|
|
|
|
| AND PUBLIC LANDS |
|
|
|
|
|
|
|
|
|
| John English-Libertarian Party |
17 |
18 |
10 |
20 |
14 |
22 |
27 |
19 |
147 |
| Ryan Brunner-Republican Party |
72 |
68 |
45 |
61 |
44 |
98 |
83 |
58 |
529 |
|
|
|
|
|
|
|
|
|
|
| PUBLIC UTILITIES COMMISSIONER |
|
|
|
|
|
|
|
|
|
| Wayne Schmidt-Constitution Party |
3 |
4 |
1 |
5 |
3 |
4 |
5 |
5 |
30 |
| David Allen-Democratic Party |
38 |
32 |
24 |
32 |
24 |
33 |
41 |
22 |
246 |
| Gary Hanson-Republican Party |
62 |
62 |
38 |
66 |
37 |
104 |
76 |
58 |
503 |
|
|
|
|
|
|
|
|
|
|
| STATE SENATOR DISTRICT 8 |
|
|
|
|
|
|
|
|
|
| Scott Parsley-Democratic Party |
73 |
63 |
44 |
69 |
32 |
71 |
84 |
45 |
481 |
| Chuck Jones-Republican Party |
39 |
46 |
26 |
39 |
33 |
71 |
51 |
45 |
350 |
|
|
|
|
|
|
|
|
|
|
| STATE REPRESENTATIVE DISTRICT 8 |
|
|
|
|
|
|
|
|
|
| Patrick G. Heinemann-Democratic Party |
38 |
32 |
18 |
38 |
17 |
33 |
44 |
21 |
241 |
| Jeff Nelson-Democratic Party |
60 |
53 |
37 |
48 |
34 |
59 |
72 |
38 |
401 |
| Dr. Leslie Heinemann-Republican Party |
44 |
44 |
27 |
44 |
34 |
71 |
42 |
45 |
351 |
| Mathew Wollmann-Republican Party |
46 |
46 |
31 |
43 |
30 |
72 |
54 |
44 |
366 |
|
|
|
|
|
|
|
|
|
|
| COUNTY COMMISSIONER AT LARGE |
|
|
|
|
|
|
|
|
|
| Garrett D Gassman-Democratic Party |
51 |
49 |
38 |
79 |
31 |
57 |
66 |
39 |
410 |
| Roger Wentland-Republican Party |
65 |
61 |
40 |
54 |
27 |
92 |
86 |
37 |
462 |
| Donald Bowman-Republican Party |
40 |
51 |
33 |
52 |
51 |
75 |
58 |
49 |
409 |
| Tom Reisch-Independent |
82 |
75 |
51 |
63 |
33 |
117 |
92 |
51 |
564 |
|
|
|
|
|
|
|
|
|
|
| SUPREME COURT JUSTICE RETENTION |
|
|
|
|
|
|
|
|
|
| Justice Steven L. Zinter |
|
|
|
|
|
|
|
|
|
| Yes |
64 |
62 |
31 |
66 |
42 |
88 |
80 |
52 |
485 |
| No |
11 |
18 |
11 |
12 |
9 |
15 |
20 |
17 |
113 |
|
|
|
|
|
|
|
|
|
|
| Justice Lori Scully Wilbur |
|
|
|
|
|
|
|
|
|
| Yes |
68 |
66 |
35 |
66 |
41 |
82 |
81 |
52 |
491 |
| No |
10 |
12 |
7 |
10 |
10 |
18 |
19 |
16 |
102 |
|
|
|
|
|
|
|
|
|
|
| Justice David Gilbertson |
|
|
|
|
|
|
|
|
|
| Yes |
66 |
69 |
38 |
68 |
39 |
87 |
91 |
55 |
513 |
| No |
12 |
12 |
7 |
11 |
11 |
14 |
11 |
13 |
91 |
|
|
|
|
|
|
|
|
|
|
| FOR JUDGE OF THE CIRCUIT COURT |
|
|
|
|
|
|
|
|
|
| Third Circuit, Position A |
|
|
|
|
|
|
|
|
|
| Robert L. Timm |
41 |
38 |
22 |
40 |
16 |
48 |
45 |
37 |
287 |
|
|
|
|
|
|
|
|
|
|
| Third Circuit, Position B |
|
|
|
|
|
|
|
|
|
| Vincent A. Foley |
43 |
39 |
22 |
40 |
16 |
48 |
47 |
36 |
291 |
|
|
|
|
|
|
|
|
|
|
| Third Circuit, Position C |
|
|
|
|
|
|
|
|
|
| Jon R. Erickson |
40 |
38 |
22 |
39 |
21 |
51 |
45 |
34 |
290 |
|
|
|
|
|
|
|
|
|
|
| Third Circuit, Position D |
|
|
|
|
|
|
|
|
|
| Gregory J. Stoltenburg |
37 |
38 |
21 |
39 |
16 |
47 |
46 |
36 |
280 |
|
|
|
|
|
|
|
|
|
|
| Third Circuit, Position E |
|
|
|
|
|
|
|
|
|
| Robert L. Spears |
28 |
37 |
20 |
28 |
19 |
41 |
37 |
29 |
239 |
| Ronald K. Roehr |
12 |
12 |
9 |
15 |
7 |
17 |
17 |
6 |
95 |
|
|
|
|
|
|
|
|
|
|
| Third Circuit, Position F |
|
|
|
|
|
|
|
|
|
| Tim D. Tucker |
55 |
54 |
38 |
60 |
27 |
71 |
80 |
42 |
427 |
|
|
|
|
|
|
|
|
|
|
| CONSTITUTIONAL AMENDMENT Q |
|
|
|
|
|
|
|
|
|
| Yes |
54 |
55 |
26 |
48 |
26 |
81 |
58 |
50 |
398 |
| No |
56 |
53 |
39 |
55 |
41 |
60 |
84 |
41 |
429 |
|
|
|
|
|
|
|
|
|
|
|
|
|
|
|
|
|
|
|
|
| INITIATED MEASURE 17 |
|
|
|
|
|
|
|
|
|
| Yes |
71 |
63 |
35 |
60 |
40 |
78 |
86 |
40 |
473 |
| No |
42 |
43 |
35 |
49 |
29 |
68 |
59 |
50 |
375 |
|
|
|
|
|
|
|
|
|
|
| INITIATED MEASURE 18 |
|
|
|
|
|
|
|
|
|
| Yes |
64 |
64 |
36 |
54 |
30 |
61 |
71 |
31 |
411 |
| No |
52 |
48 |
36 |
56 |
40 |
91 |
73 |
60 |
456 |
|
|
|
|
|
|
|
|
|
|
| BALLOTS CAST |
120 |
114 |
75 |
116 |
71 |
159 |
151 |
93 |
899 |
| REGISTERED VOTERS |
221 |
203 |
181 |
240 |
109 |
289 |
265 |
176 |
1684 |
| TURN OUT % |
54% |
56% |
41% |
48% |
65% |
55% |
57% |
53% |
53% |
________________________________________________________________________________
The following results are listed according to precinct.
Precinct 1 - Howard City Ward 1
Precinct 2 - Howard City Ward 2
Precinct 3 - Howard City Ward 3
Precinct 4 - Vermillion, Canova, Rock Creek, & Town of Canova
Precinct 5 - Beaver, Clinton, Miner
Precinct 6 - Clearwater, Howard, Roswell, Vilas Village, & Roswell Village
Precinct 7 - Henden, Adams, Belleview, Grafton
Precinct 8 - Green Valley, Carthage, Redstone & City of Carthage
2014 Primary Election Results
| No. in of 8 Precincts-8 |
1 |
2 |
3 |
4 |
5 |
6 |
7 |
8 |
Total |
|
|
|
|
|
|
|
|
|
|
| DEMOCRATIC GOVERNOR |
|
|
|
|
|
|
|
|
|
| Susan Wismer |
6 |
8 |
8 |
2 |
6 |
8 |
10 |
14 |
62 |
| Joe Lowe |
16 |
10 |
19 |
9 |
5 |
2 |
8 |
5 |
74 |
|
|
|
|
|
|
|
|
|
|
|
|
|
|
|
|
|
|
|
|
| REPUBLICAN |
|
|
|
|
|
|
|
|
|
| UNITED STATES SENATOR |
|
|
|
|
|
|
|
|
|
|
|
|
|
|
|
|
|
|
|
| Stace Nelson |
6 |
11 |
5 |
11 |
15 |
11 |
10 |
14 |
83 |
| Mike Rounds |
11 |
16 |
8 |
5 |
5 |
19 |
7 |
17 |
88 |
| Dr. Annette Bosworth |
0 |
1 |
0 |
0 |
0 |
1 |
1 |
1 |
4 |
| Jason Ravnsborg |
1 |
0 |
0 |
0 |
0 |
1 |
1 |
0 |
3 |
| Larry Rhoden |
4 |
3 |
0 |
2 |
2 |
10 |
5 |
2 |
28 |
|
|
|
|
|
|
|
|
|
|
| REPUBLICAN GOVERNOR |
|
|
|
|
|
|
|
|
|
| Lora Hubbel |
2 |
4 |
3 |
6 |
9 |
6 |
9 |
11 |
50 |
| Dennis M. Daugaard |
20 |
26 |
10 |
11 |
13 |
35 |
13 |
23 |
151 |
|
|
|
|
|
|
|
|
|
|
| DEMOCRATIC BALLOTS CAST |
24 |
19 |
28 |
13 |
12 |
10 |
20 |
20 |
146 |
| REPUBLICAN BALLOTS CAST |
22 |
31 |
13 |
18 |
22 |
42 |
24 |
34 |
206 |
| TOTAL BALLOTS CAST |
46 |
50 |
41 |
31 |
34 |
52 |
44 |
54 |
352 |
| REGISTERED DEMOCRATIC VOTERS |
113 |
91 |
82 |
122 |
39 |
101 |
129 |
68 |
745 |
| REGISTERED REPUBLICAN VOTERS |
53 |
58 |
61 |
63 |
41 |
136 |
81 |
69 |
562 |
| REGISTERED INDEPENDENT VOTERS |
32 |
35 |
23 |
41 |
19 |
40 |
40 |
29 |
259 |
| DEMOCRATIC TURNOUT (INCLUDING INDEPENDENTS) |
16.6% |
15.1% |
26.7% |
8.0% |
20.7% |
7.1% |
11.8% |
20.6% |
14.5% |
| REPUBLICAN TURNOUT |
41.5% |
53.4% |
21.3% |
28.6% |
53.7% |
30.9% |
29.6% |
49.3% |
36.7% |
| TOTAL REGISTERED VOTERS |
198 |
184 |
166 |
226 |
99 |
277 |
250 |
166 |
1566 |
| TOTAL TURN OUT % |
23% |
27% |
25% |
14% |
34% |
19% |
18% |
33% |
22% |
2012 General Election Results
| MINER COUNTY PARTY/CANDIDATES |
1 |
2 |
3 |
4 |
5 |
6 |
7 |
8 |
TOTAL |
| No. in of 8 Precincts- |
|
|
|
|
|
|
|
|
|
|
|
|
|
|
|
|
|
|
|
| For Presidential Electors |
|
|
|
|
|
|
|
|
|
| Obama & Biden Electors |
73 |
69 |
50 |
75 |
27 |
65 |
77 |
43 |
479 |
| Goode & Clymer Electors |
1 |
1 |
0 |
2 |
2 |
0 |
1 |
0 |
7 |
| Romney & Ryan Electors |
77 |
71 |
71 |
69 |
44 |
127 |
106 |
71 |
636 |
| Johnson & Gray Electors |
1 |
1 |
4 |
0 |
3 |
1 |
2 |
6 |
18 |
|
|
|
|
|
|
|
|
|
|
| For United States Representative |
|
|
|
|
|
|
|
|
|
| Matt Varilek |
83 |
75 |
52 |
75 |
28 |
83 |
89 |
45 |
530 |
| Kristi Noem |
66 |
69 |
70 |
74 |
50 |
114 |
101 |
79 |
623 |
|
|
|
|
|
|
|
|
|
|
| For Public Utilities Commissioner Six Year Term |
|
|
|
|
|
|
|
|
|
| Matt McGovern |
78 |
66 |
55 |
69 |
33 |
86 |
84 |
43 |
514 |
| Kristie Fiegen |
60 |
67 |
60 |
61 |
38 |
99 |
82 |
64 |
531 |
| Russell Clarke |
3 |
7 |
8 |
12 |
7 |
8 |
16 |
11 |
72 |
|
|
|
|
|
|
|
|
|
|
| For Public Utilities Commissioner Four Year Term |
|
|
|
|
|
|
|
|
|
| Nick Nemec |
57 |
53 |
37 |
54 |
32 |
53 |
65 |
44 |
395 |
| Chris Nelson |
80 |
88 |
77 |
90 |
45 |
127 |
110 |
70 |
687 |
|
|
|
|
|
|
|
|
|
|
| For State Senator District 8 |
|
|
|
|
|
|
|
|
|
| Charles J. Johnson |
61 |
60 |
36 |
57 |
25 |
52 |
60 |
38 |
389 |
| Russell Olson |
82 |
82 |
84 |
88 |
53 |
135 |
122 |
82 |
728 |
|
|
|
|
|
|
|
|
|
|
| For State Representatives District 8-vote for 2 |
|
|
|
|
|
|
|
|
|
| Scott Parsley |
90 |
94 |
63 |
99 |
44 |
106 |
92 |
69 |
657 |
| Roy J. Lindsay |
58 |
57 |
38 |
61 |
29 |
59 |
65 |
39 |
406 |
| Gene E. Kroger |
42 |
46 |
45 |
40 |
33 |
75 |
59 |
47 |
387 |
| Leslie J. Heinemann |
55 |
57 |
53 |
54 |
39 |
92 |
71 |
49 |
470 |
|
|
|
|
|
|
|
|
|
|
| Supreme Court Justice Retention |
|
|
|
|
|
|
|
|
|
| Justice Glen A. Severson |
|
|
|
|
|
|
|
|
|
| Yes |
99 |
105 |
71 |
96 |
49 |
126 |
123 |
74 |
743 |
| No |
24 |
20 |
23 |
30 |
17 |
33 |
31 |
27 |
205 |
|
|
|
|
|
|
|
|
|
|
| Water Development District |
|
|
|
|
|
|
|
|
|
| For East Dakota Water Development District Director |
|
|
|
|
|
|
|
|
|
| Gary Duffy |
43 |
38 |
24 |
25 |
|
43 |
45 |
|
218 |
| John Weidler |
85 |
83 |
74 |
82 |
|
107 |
122 |
|
553 |
|
|
|
|
|
|
|
|
|
|
| For James River Water Development District Director |
|
|
|
|
|
|
|
|
|
| Leon Fredrichs |
|
|
|
3 |
36 |
2 |
|
30 |
71 |
| Gary Boomsma |
|
|
|
10 |
16 |
11 |
|
45 |
82 |
|
|
|
|
|
|
|
|
|
|
| Constitutional Amendment M |
|
|
|
|
|
|
|
|
|
| Yes |
41 |
33 |
29 |
33 |
14 |
47 |
37 |
22 |
256 |
| No |
90 |
92 |
82 |
100 |
61 |
120 |
127 |
91 |
763 |
|
|
|
|
|
|
|
|
|
|
| Constitutional Amendment N |
|
|
|
|
|
|
|
|
|
| Yes |
43 |
55 |
32 |
48 |
32 |
61 |
52 |
31 |
354 |
| No |
95 |
80 |
83 |
94 |
46 |
113 |
127 |
83 |
721 |
|
|
|
|
|
|
|
|
|
|
| Constitutional Amendment O |
|
|
|
|
|
|
|
|
|
| Yes |
68 |
71 |
58 |
62 |
31 |
85 |
85 |
53 |
513 |
| No |
66 |
60 |
54 |
76 |
45 |
82 |
88 |
60 |
531 |
|
|
|
|
|
|
|
|
|
|
| Constitutional Amendment P |
|
|
|
|
|
|
|
|
|
| Yes |
76 |
81 |
63 |
73 |
42 |
106 |
94 |
69 |
604 |
| No |
60 |
49 |
48 |
67 |
35 |
65 |
76 |
44 |
444 |
|
|
|
|
|
|
|
|
|
|
| Initiated Measure 15 |
|
|
|
|
|
|
|
|
|
| Yes |
73 |
73 |
44 |
60 |
15 |
75 |
78 |
43 |
461 |
| No |
69 |
70 |
77 |
86 |
63 |
114 |
107 |
74 |
660 |
|
|
|
|
|
|
|
|
|
|
| Referred Law 14 |
|
|
|
|
|
|
|
|
|
| Yes |
37 |
50 |
49 |
44 |
18 |
55 |
45 |
34 |
332 |
| No |
93 |
80 |
62 |
98 |
60 |
116 |
131 |
80 |
720 |
|
|
|
|
|
|
|
|
|
|
| Referred Law 16 |
|
|
|
|
|
|
|
|
|
| Yes |
27 |
34 |
25 |
39 |
13 |
49 |
37 |
30 |
254 |
| No |
115 |
108 |
95 |
105 |
64 |
141 |
145 |
89 |
862 |
|
|
|
|
|
|
|
|
|
|
| Question-Should Miner County be withdrawn from |
|
|
|
|
|
|
|
|
|
| the James River Water Development District? |
|
|
|
|
|
|
|
|
|
| Yes |
|
|
|
9 |
47 |
15 |
|
56 |
127 |
| No |
|
|
|
10 |
29 |
7 |
|
53 |
99 |
|
|
|
|
|
|
|
|
|
|
| |
|
|
|
|
|
|
|
|
|
|
|
|
|
|
|
|
|
|
|
| TOTAL BALLOTS CAST |
152 |
148 |
128 |
151 |
80 |
200 |
191 |
127 |
1177 |
|
|
|
|
|
|
|
|
|
|
| TOTAL REGISTERED VOTERS |
218 |
197 |
193 |
239 |
104 |
298 |
261 |
176 |
1686 |
| TOTAL TURN OUT % |
70% |
75% |
66% |
63% |
77% |
67% |
73% |
72% |
70% |
2012 Primary Results
| MINER COUNTY PARTY/CANDIDATES |
HOWARD WARD 1 |
HOWARD WARD 2 |
HOWARD WARD 3 |
VERMILLION-CANOVA-ROCK CREEK |
BEAVER-CLINTON-MINER |
CLEARWATER-HOWARD-ROSWELL |
HENDEN-ADAMS-BELLEVIEW-GRAFTON |
GREEN VALLEY-CARTHAGE-REDSTONE |
TOTAL |
| No. in of 8 Precincts-8 |
|
|
|
|
|
|
|
|
|
|
|
|
|
|
|
|
|
|
|
| DEMOCRATIC UNITED STATES REPRESENTATIVE |
|
|
|
|
|
|
|
|
|
| Jeff Barth |
10 |
9 |
4 |
6 |
5 |
3 |
3 |
5 |
45 |
| Matt Varilek |
17 |
19 |
16 |
12 |
7 |
13 |
19 |
12 |
115 |
|
|
|
|
|
|
|
|
|
|
|
|
|
|
|
|
|
|
|
|
| REPUBLICAN PRESIDENTIAL DELEGATES |
|
|
|
|
|
|
|
|
|
| AND ALTERNATES |
|
|
|
|
|
|
|
|
|
| CANDIDATES PREFERRING |
|
|
|
|
|
|
|
|
|
| to be uncommitted |
0 |
0 |
0 |
0 |
1 |
1 |
1 |
1 |
4 |
| Ron Paul |
1 |
2 |
0 |
4 |
4 |
4 |
1 |
1 |
17 |
| Mitt Romney |
10 |
9 |
5 |
5 |
8 |
9 |
3 |
14 |
63 |
| Rick Santorum |
0 |
4 |
2 |
1 |
0 |
3 |
4 |
1 |
15 |
| Newt Gingrich |
2 |
1 |
0 |
0 |
2 |
0 |
2 |
0 |
7 |
|
|
|
|
|
|
|
|
|
|
| DEMOCRATIC BALLOTS CAST |
27 |
29 |
20 |
18 |
12 |
16 |
22 |
18 |
162 |
| REPUBLICAN BALLOTS CAST |
13 |
17 |
8 |
11 |
15 |
17 |
13 |
17 |
111 |
| TOTAL BALLOTS CAST |
40 |
46 |
28 |
29 |
27 |
33 |
35 |
35 |
273 |
| REGISTERED DEMOCRATIC VOTERS |
142 |
105 |
95 |
137 |
46 |
109 |
156 |
72 |
862 |
| REGISTERED REPUBLICAN VOTERS |
57 |
60 |
72 |
73 |
49 |
146 |
83 |
77 |
617 |
| REGISTERED INDEPENDENT VOTERS |
27 |
31 |
29 |
44 |
24 |
39 |
42 |
27 |
263 |
| DEMOCRATIC TURNOUT (INCLUDING INDEPENDENTS) |
16.0% |
21.3% |
16.1% |
9.9% |
17.1% |
10.8% |
11.1% |
18.2% |
14.4% |
| REPUBLICAN TURNOUT |
22.8% |
28.3% |
11.1% |
15.1% |
30.6% |
11.6% |
15.7% |
22.1% |
18.0% |
| TOTAL REGISTERED VOTERS |
226 |
196 |
196 |
254 |
119 |
294 |
281 |
176 |
1742 |
| TOTAL TURN OUT % |
18% |
23% |
14% |
11% |
23% |
11% |
12% |
20% |
16% |
2010 GENERAL ELECTION RESULTS
| MINER COUNTY PARTY/CANDIDATES |
1 |
2 |
3 |
4 |
5 |
6 |
7 |
8 |
TOTAL |
| No. in of 8 Precincts- |
|
|
|
|
|
|
|
|
|
|
|
|
|
|
|
|
|
|
|
| UNITED STATES SENATOR |
|
|
|
|
|
|
|
|
|
| John R. Thune-Republican Party |
81 |
102 |
73 |
97 |
55 |
125 |
115 |
77 |
725 |
|
|
|
|
|
|
|
|
|
|
| UNITED STATES REPRESENTATIVE |
|
|
|
|
|
|
|
|
|
| Kristi Noem-Republican Party |
50 |
56 |
51 |
50 |
34 |
88 |
76 |
53 |
458 |
| Stephanie Herseth Sandlin-Democratic Party |
75 |
78 |
62 |
87 |
42 |
78 |
95 |
64 |
581 |
| B. Thomas Marking-Independent |
8 |
10 |
13 |
11 |
7 |
8 |
14 |
5 |
76 |
|
|
|
|
|
|
|
|
|
|
| GOVERNOR AND LIEUTENANT GOVERNOR |
|
|
|
|
|
|
|
|
|
| Dennis Daugaard-Matt Michels-Republican Party |
68 |
76 |
56 |
81 |
38 |
111 |
103 |
62 |
595 |
| Scott Heidepriem-Ben Arndt-Democratic Party |
70 |
66 |
72 |
66 |
42 |
64 |
82 |
60 |
522 |
|
|
|
|
|
|
|
|
|
|
| SECRETARY OF STATE |
|
|
|
|
|
|
|
|
|
| Lori Stacey-Constitution Party |
7 |
8 |
6 |
14 |
4 |
6 |
11 |
12 |
68 |
| Jason Gant-Republican Party |
44 |
60 |
52 |
51 |
41 |
91 |
75 |
55 |
469 |
| Ben Nesselhuf-Democratic Party |
79 |
67 |
64 |
72 |
34 |
74 |
82 |
53 |
525 |
|
|
|
|
|
|
|
|
|
|
| ATTORNEY GENERAL |
|
|
|
|
|
|
|
|
|
| Marty Jackley-Republican Party |
71 |
85 |
60 |
92 |
54 |
111 |
98 |
74 |
645 |
| Ron Volesky-Democratic Party |
62 |
53 |
64 |
49 |
28 |
59 |
68 |
47 |
430 |
|
|
|
|
|
|
|
|
|
|
| STATE AUDITOR |
|
|
|
|
|
|
|
|
|
| Steve Barnett-Republican Party |
52 |
78 |
58 |
66 |
41 |
98 |
83 |
62 |
538 |
| Julie Bartling-Demcratic Party |
74 |
58 |
62 |
71 |
36 |
69 |
77 |
55 |
502 |
|
|
|
|
|
|
|
|
|
|
| STATE TREASURER |
|
|
|
|
|
|
|
|
|
| Rich Sattgast-Republican Party |
64 |
86 |
70 |
84 |
49 |
119 |
99 |
78 |
649 |
| Tom Katus-Democratic Party |
61 |
46 |
52 |
49 |
26 |
44 |
61 |
41 |
380 |
|
|
|
|
|
|
|
|
|
|
| COMMISSIONER OF SCHOOL |
|
|
|
|
|
|
|
|
|
| AND PUBLIC LANDS |
|
|
|
|
|
|
|
|
|
| Jarrod Johnson-Republican Party |
56 |
79 |
65 |
82 |
45 |
100 |
94 |
68 |
589 |
| Bob Pille-Democratic Party |
58 |
46 |
56 |
46 |
29 |
56 |
62 |
41 |
394 |
|
|
|
|
|
|
|
|
|
|
| PUBLIC UTILITIES COMMISSIONER |
|
|
|
|
|
|
|
|
|
| Dustin "Dusty"Johnson-Republican Party |
79 |
109 |
80 |
103 |
52 |
127 |
122 |
74 |
746 |
| Doyle Karpen-Democratic Party |
50 |
29 |
42 |
34 |
27 |
44 |
46 |
42 |
314 |
|
|
|
|
|
|
|
|
|
|
| STATE SENATOR DISTRICT 8 |
|
|
|
|
|
|
|
|
|
| Russell Olson-Republican Party |
87 |
113 |
85 |
98 |
62 |
143 |
136 |
80 |
804 |
| Clark Schmidtke Sr.-Independent |
30 |
23 |
26 |
31 |
13 |
21 |
26 |
30 |
200 |
|
|
|
|
|
|
|
|
|
|
| STATE REPRESENTATIVE DISTRICT 8 |
|
|
|
|
|
|
|
|
|
| Patricia K. Stricherz-Republican Party |
34 |
47 |
44 |
44 |
32 |
59 |
49 |
48 |
357 |
| Mitch Fargen-Democratic Party |
82 |
91 |
75 |
94 |
39 |
100 |
106 |
66 |
653 |
| Gerald Lange-Democratic Party |
55 |
67 |
57 |
73 |
31 |
77 |
85 |
45 |
490 |
| Jason Lee Bjorklund-Independent |
41 |
31 |
28 |
37 |
27 |
49 |
39 |
39 |
291 |
|
|
|
|
|
|
|
|
|
|
| COUNTY COMMISSIONER AT LARGE |
|
|
|
|
|
|
|
|
|
| Roger Wentland-Republican Party |
82 |
73 |
68 |
77 |
34 |
124 |
141 |
66 |
665 |
| Don Bowman-Republican Party |
75 |
95 |
76 |
92 |
63 |
120 |
97 |
72 |
690 |
| Rollin D Schulz-Democratic Party |
73 |
75 |
68 |
95 |
37 |
71 |
75 |
58 |
552 |
| Patrick R. Maroney-Democratic Party |
82 |
90 |
81 |
64 |
40 |
103 |
92 |
56 |
608 |
|
|
|
|
|
|
|
|
|
|
| WATER DEVELOPMENT DISTRICT |
|
|
|
|
|
|
|
|
|
| DIRECTOR-EAST DAKOTA-AREA 2 |
|
|
|
|
|
|
|
|
|
| John F. Weidler |
85 |
97 |
91 |
77 |
|
109 |
125 |
|
584 |
| Douglas Feten |
25 |
19 |
20 |
22 |
|
20 |
27 |
|
133 |
|
|
|
|
|
|
|
|
|
|
| CONSTITUTIONAL AMENDMENT K |
|
|
|
|
|
|
|
|
|
| Yes |
89 |
102 |
91 |
105 |
60 |
110 |
115 |
88 |
760 |
| No |
34 |
29 |
25 |
28 |
18 |
51 |
52 |
25 |
262 |
|
|
|
|
|
|
|
|
|
|
| CONSTITUTIONAL AMENDMENT L |
|
|
|
|
|
|
|
|
|
| Yes |
47 |
53 |
43 |
45 |
34 |
74 |
46 |
45 |
387 |
| No |
67 |
67 |
58 |
82 |
41 |
78 |
102 |
59 |
554 |
|
|
|
|
|
|
|
|
|
|
| INITIATED MEASURE 13 |
|
|
|
|
|
|
|
|
|
| Yes |
39 |
32 |
36 |
43 |
17 |
42 |
42 |
42 |
293 |
| No |
90 |
106 |
82 |
97 |
63 |
125 |
138 |
73 |
774 |
|
|
|
|
|
|
|
|
|
|
| REFERRED LAW 12 |
|
|
|
|
|
|
|
|
|
| Yes |
94 |
92 |
70 |
88 |
49 |
119 |
120 |
72 |
704 |
| No |
39 |
45 |
49 |
58 |
31 |
48 |
62 |
47 |
379 |
|
|
|
|
|
|
|
|
|
|
|
|
|
|
|
|
|
|
|
|
| BALLOTS CAST |
140 |
144 |
130 |
150 |
83 |
177 |
190 |
123 |
1137 |
| REGISTERED VOTERS |
217 |
197 |
207 |
246 |
106 |
281 |
263 |
177 |
1694 |
| TURN OUT % |
65% |
73% |
63% |
61% |
78% |
63% |
72% |
69% |
67% |
2010 Primary Results
| MINER COUNTY PARTY/CANDIDATES |
1 |
2 |
3 |
4 |
5 |
6 |
7 |
8 |
TOTAL |
| No. in of 8 Precincts-8 |
|
|
|
|
|
|
|
|
|
|
|
|
|
|
|
|
|
|
|
| REPUBLICAN UNITED STATES REPRESENTATIVE |
|
|
|
|
|
|
|
| Kristi Noem |
5 |
8 |
5 |
8 |
11 |
19 |
8 |
14 |
78 |
| Blake Curd |
4 |
7 |
2 |
3 |
3 |
9 |
4 |
0 |
32 |
| Chris Nelson |
17 |
18 |
12 |
12 |
7 |
17 |
6 |
12 |
101 |
|
|
|
|
|
|
|
|
|
|
| REPUBLICAN GOVERNOR |
|
|
|
|
|
|
|
|
|
| Dave Knudson |
3 |
5 |
1 |
5 |
3 |
5 |
6 |
2 |
30 |
| Scott Munsterman |
2 |
6 |
6 |
4 |
1 |
9 |
5 |
7 |
40 |
| Dennis Daugaard |
21 |
18 |
10 |
12 |
15 |
28 |
4 |
16 |
124 |
| Ken Knuppe |
0 |
0 |
0 |
0 |
0 |
0 |
0 |
1 |
1 |
| Gordon Howie |
0 |
4 |
1 |
3 |
1 |
4 |
3 |
2 |
18 |
|
|
|
|
|
|
|
|
|
|
| TOTAL BALLOTS CAST |
28 |
33 |
20 |
24 |
21 |
46 |
18 |
28 |
218 |
| REGISTERED REPUBLICAN VOTERS |
57 |
63 |
69 |
75 |
44 |
132 |
72 |
75 |
587 |
| TOTAL TURN OUT % |
49% |
52% |
29% |
32% |
48% |
35% |
25% |
37% |
37% |
2008 General Results
1 2 3 4 5 6 7 8
| Presidential Electors |
|
|
|
|
|
|
|
|
|
| Democratic-Obama and Biden |
91 |
87 |
78 |
88 |
35 |
76 |
92 |
58 |
605 |
| Constitution-Baldwin and Castle |
2 |
2 |
0 |
2 |
0 |
1 |
1 |
3 |
11 |
| Republican-McCain and Palin |
67 |
64 |
63 |
72 |
43 |
106 |
98 |
64 |
577 |
| Independent-Barr and Root |
1 |
1 |
0 |
0 |
2 |
0 |
1 |
0 |
5 |
| Independent-Nader and Gonzalez |
2 |
2 |
1 |
3 |
0 |
2 |
8 |
2 |
20 |
| United States Senate |
|
|
|
|
|
|
|
|
|
| Democratic-Tim Johnson |
124 |
118 |
107 |
133 |
54 |
129 |
156 |
94 |
915 |
| Republican-Joel Dykstra |
40 |
39 |
41 |
37 |
32 |
59 |
45 |
35 |
328 |
|
|
|
|
|
|
|
|
|
|
| United States Representative |
|
|
|
|
|
|
|
|
|
| Democratic-Stephanie Herseth Sandlin |
127 |
124 |
111 |
139 |
60 |
132 |
160 |
97 |
950 |
| Republican-Chris Lien |
36 |
34 |
36 |
30 |
25 |
55 |
37 |
31 |
284 |
| Public Utilities Commissioner |
|
|
|
|
|
|
|
|
|
| Democratic-Matt McLarty |
63 |
48 |
50 |
51 |
27 |
52 |
55 |
49 |
395 |
| Constitution-Eugene R. Hidalgo |
3 |
3 |
1 |
6 |
1 |
4 |
1 |
1 |
20 |
| Republican-Gary Hanson |
85 |
93 |
82 |
93 |
50 |
117 |
119 |
70 |
709 |
|
|
|
|
|
|
|
|
|
|
| State Senator District 8 |
|
|
|
|
|
|
|
|
|
| Democratic-Scott Parsley |
72 |
71 |
61 |
83 |
39 |
70 |
86 |
72 |
554 |
| Republican-Russell Olson |
83 |
83 |
79 |
76 |
45 |
115 |
97 |
54 |
632 |
| State Representative District 8 |
|
|
|
|
|
|
|
|
|
| Democratic-Gerald Lange |
85 |
84 |
80 |
86 |
45 |
89 |
100 |
54 |
623 |
| Democratic-Mitch Fargen |
87 |
75 |
68 |
94 |
37 |
68 |
91 |
61 |
581 |
| Republican-Patricia K. Stricherz |
38 |
30 |
42 |
42 |
29 |
53 |
37 |
35 |
306 |
| Republican-Jerry Johnson |
51 |
60 |
56 |
44 |
39 |
89 |
63 |
52 |
454 |
|
|
|
|
|
|
|
|
|
|
| CONSTITUTIONAL AMENDMENT G |
|
|
|
|
|
|
|
|
|
| Yes |
54 |
66 |
45 |
55 |
36 |
67 |
61 |
53 |
437 |
| No |
93 |
77 |
91 |
101 |
46 |
106 |
118 |
69 |
701 |
|
|
|
|
|
|
|
|
|
|
| CONSTITUTIONAL AMENDMENT H |
|
|
|
|
|
|
|
|
|
| Yes |
41 |
39 |
38 |
43 |
21 |
48 |
44 |
30 |
304 |
| No |
99 |
85 |
78 |
106 |
54 |
117 |
127 |
81 |
747 |
|
|
|
|
|
|
|
|
|
|
| CONSTITUTIONAL AMENDMENT I |
|
|
|
|
|
|
|
|
|
| Yes |
61 |
69 |
57 |
65 |
31 |
92 |
85 |
54 |
514 |
| No |
85 |
69 |
70 |
88 |
50 |
82 |
96 |
63 |
603 |
|
|
|
|
|
|
|
|
|
|
| CONSTITUTIONAL AMENDMENT J |
|
|
|
|
|
|
|
|
|
| Yes |
43 |
53 |
34 |
44 |
23 |
43 |
47 |
30 |
317 |
| No |
109 |
90 |
98 |
113 |
60 |
137 |
136 |
91 |
834 |
|
|
|
|
|
|
|
|
|
|
| INITIATED MEASURE 9 |
|
|
|
|
|
|
|
|
|
| Yes |
56 |
60 |
56 |
68 |
34 |
52 |
62 |
46 |
434 |
| No |
81 |
69 |
70 |
84 |
40 |
107 |
108 |
64 |
623 |
|
|
|
|
|
|
|
|
|
|
| INTIATED MEASURE 10 |
|
|
|
|
|
|
|
|
|
| Yes |
41 |
34 |
47 |
34 |
29 |
36 |
46 |
36 |
303 |
| No |
109 |
105 |
90 |
127 |
52 |
142 |
138 |
84 |
847 |
|
|
|
|
|
|
|
|
|
|
| INITIATED MEASURE 11 |
|
|
|
|
|
|
|
|
|
| Yes |
83 |
80 |
66 |
79 |
35 |
101 |
104 |
53 |
601 |
| No |
72 |
65 |
76 |
88 |
48 |
84 |
95 |
71 |
599 |
|
|
|
|
|
|
|
|
|
|
|
|
|
|
|
|
|
|
|
|
| BALLOTS CAST |
166 |
158 |
150 |
171 |
87 |
191 |
202 |
132 |
1257 |
| REGISTERED VOTERS |
230 |
208 |
211 |
257 |
120 |
279 |
280 |
177 |
1762 |
| TURN OUT % |
72% |
76% |
71% |
67% |
73% |
68% |
72% |
75% |
71% |
2008 Primary Results
|
REPUBLICAN-PRESIDENTIAL DELEGATES
|
Prec 1 |
Prec 2 |
Prec 3 |
Prec 4 |
Prec 5 |
Prec 6 |
Prec 7 |
Prec 8 |
Total |
|
Ron Paul
|
1
|
4
|
1
|
0
|
2
|
7
|
3
|
3
|
21
|
|
John McCain
|
11
|
13
|
10
|
6
|
4
|
11
|
6
|
11
|
72
|
|
Mike Huckabee
|
2
|
1
|
2
|
4
|
1
|
4
|
3
|
6
|
23
|
|
to be Uncommitted
|
0
|
0
|
0
|
0
|
0
|
1
|
0
|
0
|
1
|
|
Mitt Romney
|
0
|
2
|
1
|
0
|
2
|
2
|
0
|
2
|
9
|
|
|
|
|
|
|
|
|
|
|
|
REPUBLICAN UNITED STATES SENATE
|
|
|
|
|
|
|
|
|
|
|
Sam Kephart
|
1
|
1
|
2
|
5
|
1
|
9
|
5
|
2
|
26
|
|
Charles Lyonel Gonyo
|
1
|
3
|
0
|
1
|
1
|
3
|
2
|
3
|
14
|
|
Joel Dykstra
|
13
|
11
|
7
|
4
|
6
|
14
|
5
|
11
|
71
|
|
|
|
|
|
|
|
|
|
|
|
DEMOCRATIC PRESIDENTIAL DELEGATES
|
|
|
|
|
|
|
|
|
|
|
Hillary Clinton
|
49
|
39
|
45
|
23
|
18
|
37
|
54
|
28
|
293
|
|
Barack Obama
|
28
|
28
|
29
|
35
|
7
|
26
|
26
|
9
|
188
|
|
|
|
|
|
|
|
|
|
|
|
REPUBLICAN BALLOTS CAST
|
17
|
20
|
14
|
11
|
9
|
27
|
13
|
22
|
133
|
|
DEMOCRATIC BALLOTS CAST
|
78
|
67
|
74
|
59
|
25
|
63
|
81
|
38
|
485
|
|
TOTAL BALLOTS CAST
|
95
|
87
|
88
|
70
|
34
|
90
|
94
|
60
|
618
|
|
REGISTERED REPUBLICAN VOTERS
|
76
|
75
|
87
|
84
|
53
|
126
|
77
|
86
|
664
|
|
REGISTERED DEMOCRATIC VOTERS
|
144
|
126
|
113
|
152
|
50
|
123
|
160
|
87
|
955
|
|
TOTAL REGISTERED VOTERS
|
220
|
201
|
200
|
236
|
103
|
249
|
237
|
173
|
1619
|
|
REPUBLICAN TURN OUT %
|
22%
|
27%
|
16%
|
13%
|
17%
|
21%
|
17%
|
26%
|
20%
|
|
DEMOCRATIC TURN OUT %
|
54%
|
53%
|
65%
|
39%
|
50%
|
51%
|
51%
|
44%
|
51%
|
|
TOTAL TURN OUT %
|
43%
|
43%
|
44%
|
30%
|
33%
|
36%
|
40%
|
35%
|
38%
|
2006 Primary Results
|
MINER COUNTY PARTY/CANDIDATES
|
|
|
|
|
|
|
|
|
TOTAL
|
|
No. in of 8 Precincts-8
|
1
|
2
|
3
|
4
|
5
|
6
|
7
|
8
|
|
|
|
|
|
|
|
|
|
|
|
|
|
DEMOCRATIC-GOVERNOR
|
|
|
|
|
|
|
|
|
|
|
Jack Billion
|
32
|
17
|
28
|
6
|
6
|
10
|
15
|
10
|
124
|
|
Dennis J. Wiese
|
13
|
18
|
15
|
18
|
7
|
11
|
11
|
9
|
102
|
|
|
|
|
|
|
|
|
|
|
|
|
JUDGE OF THE CIRCUIT COURT
|
|
|
|
|
|
|
|
|
|
|
3RD CIRCUIT-POSITION B
|
|
|
|
|
|
|
|
|
|
|
Sean M. O'Brien
|
45
|
46
|
41
|
17
|
11
|
26
|
23
|
16
|
225
|
|
Vincent A. Foley
|
9
|
13
|
12
|
11
|
9
|
5
|
4
|
11
|
74
|
|
Ronald Aho
|
3
|
3
|
1
|
2
|
3
|
3
|
6
|
7
|
28
|
|
|
|
|
|
|
|
|
|
|
|
|
|
|
|
|
|
|
|
|
|
|
|
BALLOTS CAST
|
62
|
65
|
63
|
34
|
26
|
36
|
35
|
38
|
359
|
|
REGISTERED VOTERS
|
238
|
222
|
226
|
280
|
137
|
270
|
270
|
190
|
1833
|
|
TURN OUT %
|
26%
|
29%
|
28%
|
12%
|
19%
|
13%
|
13%
|
20%
|
20%
|
2006 General Election Results
| MINER COUNTY PARTY/CANDIDATES |
|
|
|
|
|
|
|
|
TOTAL |
| No. in of 8 Precincts- |
1 |
2 |
3 |
4 |
5 |
6 |
7 |
8 |
|
|
|
|
|
|
|
|
|
|
|
| UNITED STATES REPRESENTATIVE |
|
|
|
|
|
|
|
|
|
| Bruce W. Whalen |
34 |
36 |
23 |
36 |
33 |
66 |
50 |
24 |
302 |
| Stephanie Herseth |
117 |
122 |
121 |
135 |
60 |
136 |
142 |
106 |
939 |
| Larry Rudebusch |
4 |
1 |
4 |
4 |
1 |
2 |
3 |
0 |
19 |
|
|
|
|
|
|
|
|
|
|
| GOVERNOR & LIEUTENANT GOVERNOR |
|
|
|
|
|
|
|
|
|
| Mike Rounds & Dennis Daugaard |
90 |
113 |
87 |
106 |
51 |
152 |
124 |
89 |
812 |
| Steven J. Willis & Larry Johnsen |
4 |
0 |
0 |
5 |
6 |
2 |
2 |
0 |
19 |
| Jack Billion & Eric Abrahamson |
62 |
45 |
62 |
64 |
39 |
55 |
69 |
42 |
438 |
| Tom Gerber & Bette Rose Ryan |
1 |
3 |
0 |
2 |
2 |
1 |
0 |
0 |
9 |
|
|
|
|
|
|
|
|
|
|
| SECRETARY OF STATE |
|
|
|
|
|
|
|
|
|
| Chris Nelson |
99 |
107 |
86 |
115 |
67 |
145 |
110 |
79 |
808 |
|
|
|
|
|
|
|
|
|
|
| ATTORNEY GENERAL |
|
|
|
|
|
|
|
|
|
| Larry Long |
85 |
104 |
75 |
103 |
60 |
143 |
109 |
78 |
757 |
| Ron Volesky |
63 |
41 |
64 |
64 |
33 |
53 |
67 |
43 |
428 |
| Randy Ristesund |
6 |
8 |
4 |
4 |
3 |
8 |
2 |
3 |
38 |
|
|
|
|
|
|
|
|
|
|
| STATE AUDITOR |
|
|
|
|
|
|
|
|
|
| Rich Sattgast |
86 |
93 |
81 |
94 |
62 |
120 |
96 |
67 |
699 |
|
|
|
|
|
|
|
|
|
|
| STATE TREASURER |
|
|
|
|
|
|
|
|
|
| Vernon L. Larson |
86 |
91 |
83 |
95 |
65 |
118 |
88 |
73 |
699 |
|
|
|
|
|
|
|
|
|
|
| COMMISSIONER OF SCHOOL |
|
|
|
|
|
|
|
|
|
| AND PUBLIC LANDS |
|
|
|
|
|
|
|
|
|
| Jarrod Johnson |
48 |
52 |
49 |
52 |
33 |
92 |
53 |
52 |
431 |
| Bryce Healy |
91 |
93 |
82 |
103 |
58 |
104 |
117 |
68 |
716 |
| Jade Ager |
6 |
1 |
0 |
5 |
4 |
3 |
1 |
1 |
21 |
|
|
|
|
|
|
|
|
|
|
| PUBLIC UTITLITIES COMMISSIONER |
|
|
|
|
|
|
|
|
|
| John Koskan |
36 |
45 |
36 |
33 |
35 |
73 |
52 |
38 |
348 |
| Steve Kolbeck |
111 |
100 |
94 |
124 |
58 |
116 |
114 |
79 |
796 |
| Ben Sutter |
2 |
2 |
5 |
5 |
2 |
0 |
2 |
2 |
20 |
|
|
|
|
|
|
|
|
|
|
| STATE SENATOR DISTRICT 8 |
|
|
|
|
|
|
|
|
|
| John Toates |
54 |
58 |
57 |
62 |
53 |
92 |
59 |
50 |
485 |
| Dan Sutton |
96 |
89 |
79 |
99 |
40 |
106 |
111 |
72 |
692 |
|
|
|
|
|
|
|
|
|
|
| STATE REPRESENTATIVE DISTRICT 8 |
|
|
|
|
|
|
|
|
|
| Russell Olson |
52 |
69 |
45 |
47 |
41 |
89 |
55 |
47 |
445 |
| Gerald F. Lange |
63 |
70 |
70 |
64 |
40 |
89 |
102 |
49 |
547 |
| David B. Gassman |
125 |
107 |
112 |
143 |
64 |
138 |
127 |
85 |
901 |
|
|
|
|
|
|
|
|
|
|
| SUPREME COURT JUSTICE |
|
|
|
|
|
|
|
|
|
| RETENTION BALLOT |
|
|
|
|
|
|
|
|
|
| Justice John K. Konenkamp |
|
|
|
|
|
|
|
|
|
| Yes |
94 |
105 |
87 |
97 |
48 |
135 |
108 |
75 |
749 |
| No |
17 |
9 |
14 |
28 |
17 |
21 |
20 |
20 |
146 |
| Justice Richard W. Sabers |
|
|
|
|
|
|
|
|
|
| Yes |
95 |
108 |
90 |
114 |
44 |
141 |
112 |
77 |
781 |
| No |
14 |
6 |
10 |
14 |
18 |
13 |
17 |
16 |
108 |
| Justice Steven L. Zinter |
|
|
|
|
|
|
|
|
|
| Yes |
88 |
104 |
85 |
106 |
44 |
128 |
109 |
73 |
737 |
| No |
17 |
10 |
13 |
18 |
19 |
26 |
18 |
19 |
140 |
| Justice Judith K. Meierhenry |
|
|
|
|
|
|
|
|
|
| Yes |
93 |
114 |
92 |
108 |
54 |
137 |
113 |
79 |
790 |
| No |
17 |
8 |
13 |
24 |
16 |
22 |
20 |
18 |
138 |
| Justice David Gilbertson |
|
|
|
|
|
|
|
|
|
| Yes |
90 |
106 |
86 |
107 |
51 |
140 |
116 |
75 |
771 |
| No |
17 |
8 |
12 |
17 |
16 |
15 |
12 |
17 |
114 |
|
|
|
|
|
|
|
|
|
|
| JUDGE OF THE CIRCUIT COURT |
|
|
|
|
|
|
|
|
|
| 3RD CIRCUIT, POSITION A |
|
|
|
|
|
|
|
|
|
| Robert L. Timm |
61 |
77 |
69 |
68 |
45 |
90 |
72 |
68 |
550 |
| 3RD CIRCUIT-POSITION B |
|
|
|
|
|
|
|
|
|
| Vincent A. Foley |
32 |
20 |
23 |
52 |
32 |
20 |
36 |
30 |
245 |
| Sean M. O'Brien |
93 |
105 |
87 |
57 |
34 |
134 |
103 |
54 |
667 |
| 3RD CIRCUIT-POSITION C |
|
|
|
|
|
|
|
|
|
| Jon R. Erickson |
61 |
76 |
66 |
62 |
42 |
86 |
74 |
61 |
528 |
| 3RD CIRCUIT-POSITION D |
|
|
|
|
|
|
|
|
|
| David R. Gienapp |
76 |
92 |
85 |
82 |
46 |
102 |
83 |
65 |
631 |
| 3RD CIRCUIT-POSITION E |
|
|
|
|
|
|
|
|
|
| Ron Roehr |
60 |
71 |
68 |
64 |
40 |
85 |
69 |
59 |
516 |
| 3RD CIRCUIT-POSITION F |
|
|
|
|
|
|
|
|
|
| Tim D. Tucker |
85 |
89 |
79 |
85 |
52 |
102 |
87 |
67 |
646 |
|
|
|
|
|
|
|
|
|
|
| WATER DEVELOPMENT DISTRICT |
|
|
|
|
|
|
|
|
|
| DIRECTOR-EAST DAKOTA-RURAL 2 |
|
|
|
|
|
|
|
|
|
| Douglas Feten |
|
|
|
16 |
|
25 |
21 |
|
62 |
| John F. Weidler |
|
|
|
57 |
|
107 |
133 |
|
297 |
|
|
|
|
|
|
|
|
|
|
| CONSTITUTIONAL AMENDMENT C |
|
|
|
|
|
|
|
|
|
| Yes |
70 |
74 |
68 |
83 |
63 |
123 |
98 |
54 |
633 |
| No |
85 |
83 |
77 |
90 |
33 |
84 |
93 |
67 |
612 |
|
|
|
|
|
|
|
|
|
|
| CONSTITUTIONAL AMENDMENT D |
|
|
|
|
|
|
|
|
|
| Yes |
20 |
21 |
17 |
36 |
18 |
33 |
39 |
17 |
201 |
| No |
132 |
127 |
122 |
134 |
78 |
174 |
146 |
105 |
1018 |
|
|
|
|
|
|
|
|
|
|
| CONSTITUTIONAL AMENDMENT E |
|
|
|
|
|
|
|
|
|
| Yes |
8 |
15 |
7 |
15 |
20 |
8 |
22 |
10 |
105 |
| No |
147 |
139 |
136 |
159 |
75 |
198 |
165 |
115 |
1134 |
|
|
|
|
|
|
|
|
|
|
| CONSTITUTIONAL AMENDMENT F |
|
|
|
|
|
|
|
|
|
| Yes |
38 |
44 |
49 |
55 |
20 |
58 |
50 |
29 |
343 |
| No |
107 |
99 |
83 |
110 |
77 |
143 |
133 |
92 |
844 |
|
|
|
|
|
|
|
|
|
|
| INITIATED MEASURE 2 |
|
|
|
|
|
|
|
|
|
| Yes |
89 |
105 |
74 |
105 |
58 |
128 |
137 |
72 |
768 |
| No |
67 |
52 |
72 |
69 |
36 |
77 |
52 |
57 |
482 |
|
|
|
|
|
|
|
|
|
|
| INTIATED MEASURE 3 |
|
|
|
|
|
|
|
|
|
| Yes |
59 |
44 |
54 |
73 |
45 |
99 |
75 |
55 |
504 |
| No |
90 |
100 |
90 |
98 |
50 |
107 |
108 |
68 |
711 |
|
|
|
|
|
|
|
|
|
|
| INITIATED MEASURE 4 |
|
|
|
|
|
|
|
|
|
| Yes |
77 |
61 |
63 |
84 |
33 |
76 |
77 |
68 |
539 |
| No |
78 |
92 |
83 |
88 |
63 |
128 |
112 |
58 |
702 |
|
|
|
|
|
|
|
|
|
|
| INITIATED MEASURE 5 |
|
|
|
|
|
|
|
|
|
| Yes |
88 |
93 |
82 |
105 |
54 |
94 |
97 |
53 |
666 |
| No |
62 |
60 |
53 |
65 |
41 |
107 |
90 |
73 |
551 |
|
|
|
|
|
|
|
|
|
|
| INITIATED MEASURE 7 |
|
|
|
|
|
|
|
|
|
| Yes |
43 |
35 |
37 |
44 |
28 |
66 |
79 |
36 |
368 |
| No |
112 |
116 |
108 |
130 |
69 |
137 |
113 |
94 |
879 |
|
|
|
|
|
|
|
|
|
|
| INITIATED MEASURE 8 |
|
|
|
|
|
|
|
|
|
| Yes |
42 |
48 |
45 |
72 |
29 |
52 |
79 |
47 |
414 |
| No |
114 |
105 |
98 |
100 |
67 |
153 |
110 |
76 |
823 |
|
|
|
|
|
|
|
|
|
|
| REFERRED LAW 6 |
|
|
|
|
|
|
|
|
|
| Yes |
86 |
91 |
66 |
88 |
46 |
113 |
107 |
43 |
640 |
| No |
68 |
64 |
81 |
89 |
51 |
97 |
86 |
87 |
623 |
|
|
|
|
|
|
|
|
|
|
| BALLOTS CAST |
160 |
165 |
152 |
179 |
98 |
211 |
196 |
133 |
1294 |
| REGISTERED VOTERS |
237 |
228 |
234 |
278 |
125 |
274 |
273 |
187 |
1836 |
| TURN OUT % |
68% |
72% |
65% |
64% |
78% |
77% |
72% |
71% |
70% |